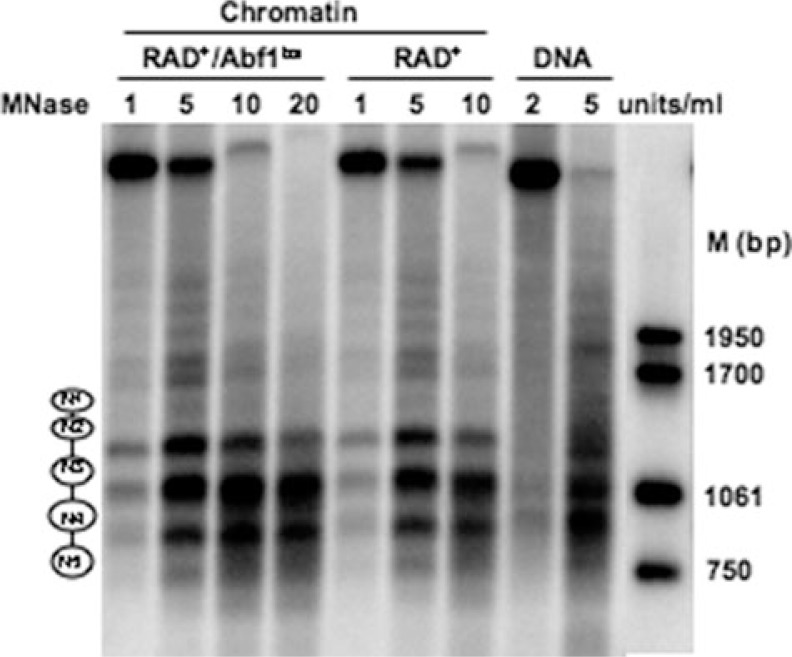
FIGURE 4.
Low resolution micrococcal nuclease nucleosome mapping. The amount of micrococcal nuclease (MNase) used is indicated at the top of each lane. Molecular weight markers (M) on the right indicate the size (bp) of the bands. The positioned nucleosomes (N1–N5) are shown as ellipses on the left.

