Figure 3.
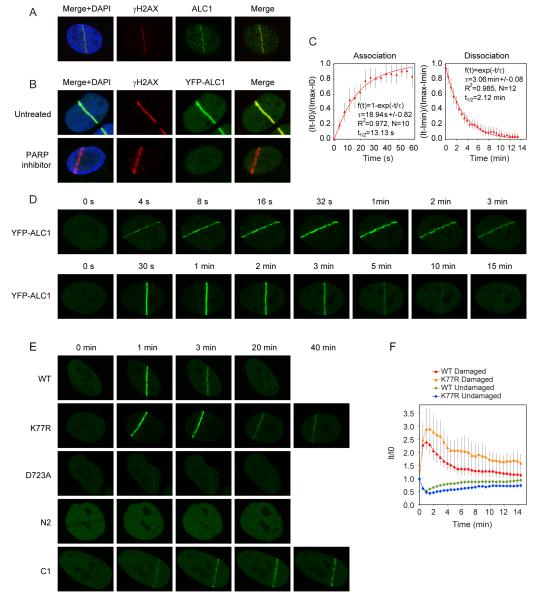
Recruitment of ALC1 to sites of laser-induced DNA damage.
(A) Endogenous ALC1 localizes to sites of laser-induced DNA damage. 1 minute after laser damage, U2OS cells were fixed and stained against γH2AX and ALC1.
(B) Recruitment of ALC1 to laser-induced DNA breaks requires active PAR synthesis. U2OS cells were transiently transfected with YFP-ALC1 and treated with PARP inhibitor where indicated. 1 minute after laser damage cells were fixed and stained against γH2AX.
(C) Kinetics of ALC1 association and dissociation from DNA breaks. Cells transiently expressing YFP-ALC1 were laser micro-irradiated and YFP fluorescence intensities at sites of laser damage were recorded over time. Mathematical modelling of ALC1 association and dissociation at sites of laser damage was carried out as described in Material and Methods. τ: time constant, N: number of cells. Error bars represent standard deviations.
(D) Rapid mobilization and transient association of ALC1 with sites of DNA damage. Shown are representative images of YFP-ALC1 recruitment and dissociation from sites of laser-induced DNA damage.
(E) Recruitment of ALC1 to DNA damage sites is Macro domain-dependent, but its efficient dissociation requires active helicase domain. The helicase core fragment of ALC1 (N2 mutant) is not recruited to DNA damage sites and the recruitment of the D723A mutant is dramatically reduced. In contrast, the ATPase dead mutant (K77R) and the Macro domain fragment (C1) show prolonged retention at sites of laser-induced damage.
(F) Comparative kinetics of the wild-type and K77R mutant ALC1 recruitment to laser-induced DNA breaks in cells transiently expressing YFP-ALC1 constructs. YFP fluorescence intensities were recorded over time in the laser-damaged region (Damaged) or within an undamaged area in the same nucleus (Undamaged) and normalized against the corresponding fluorescence intensity at the time of laser micro-irradiation. Plotted data are averaged values of a minimum of 10 cells from at least two independent experiments. Error bars represent standard deviations.

