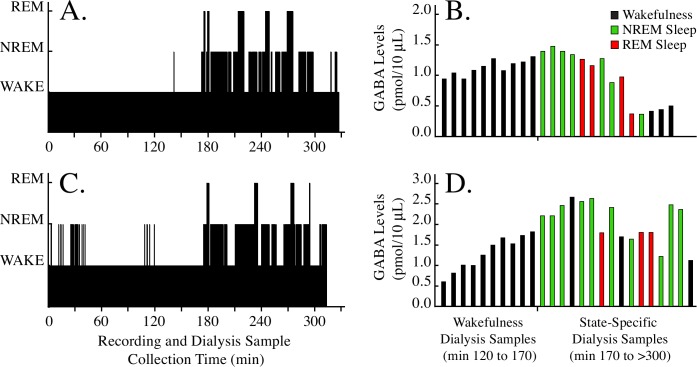
Figure 5.
Temporal organization of sleep and wakefulness in 2 representative cats, and the corresponding time-course of sequential, sample-by-sample measures of cortical GABA levels in those 2 cats. A and C. Dialysis probes were inserted into the brain at time zero. Cats were kept awake during min 0 to 170, and were allowed to sleep and wake spontaneously during min 170 to > 300. B and D. In each experiment, cortical GABA levels increased during prolonged wakefulness (min 120 to 170), and decreased progressively over time after approximately 1 h of recovery sleep (min 170 to > 300).

