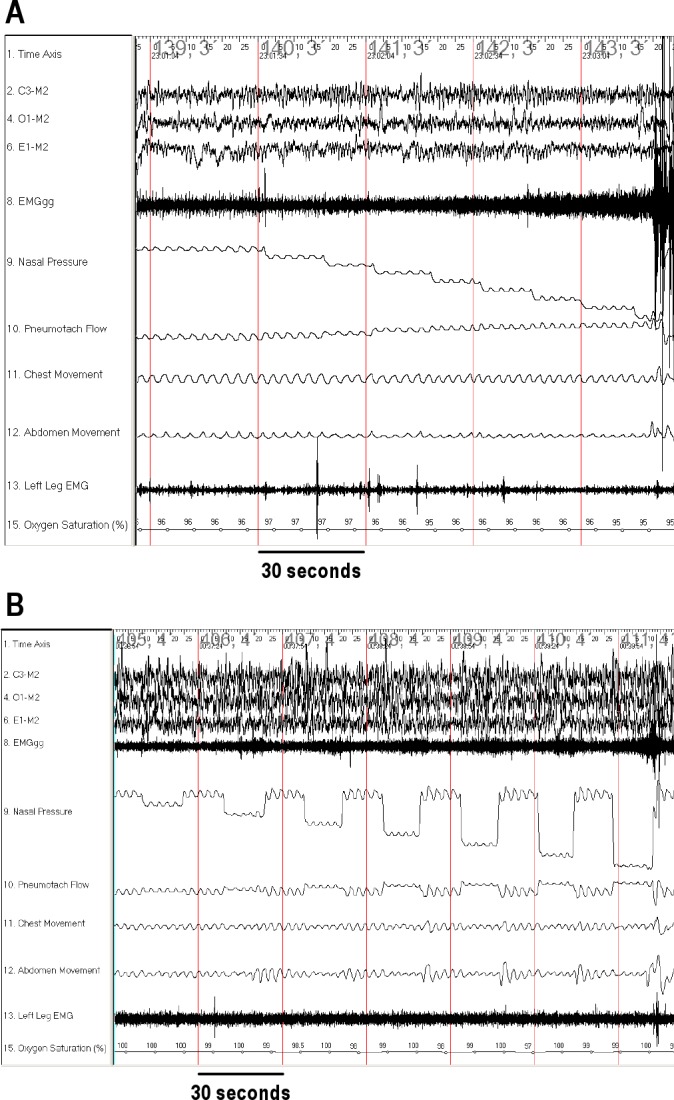
Figure 1.

Airflow and EMGgg responses to subatmospheric pressure challenges in an obese control using the activated and hypotonic techniques. Typical examples of airflow and EMGgg changes during pressure-flow runs in slow wave sleep are shown for an obese control patient. During inspiration, airflow and nasal pressure signal tracings have a negative deflection. The baseline of the airflow tracing moves upwards during the pressure drops due to the change in bias flow. (A) Activated technique. The gradual decrease in nasal was associated with a gradual increase in EMGgg and maintenance of inspiratory flow. (B) Hypotonic technique. Increases in EMGgg were observed approximately 3 breaths after each pressure drop. Note that EMGgg is calculated for the hypotonic technique using only the first 3 breaths.
