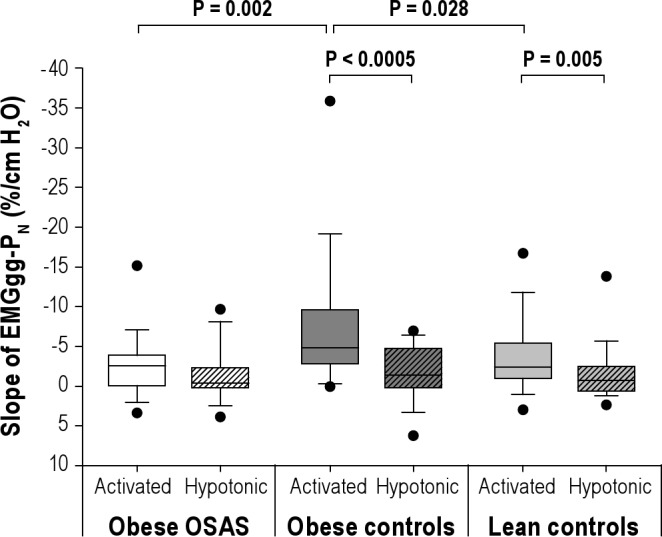
Figure 2.

Genioglossal EMG responses to subatmospheric pressure drops using the activated and hypotonic techniques. Slopes of the EMGgg versus nasal pressure (slope of EMGgg-PN) from obese OSAS, obese control, and lean control groups under the activated and hypotonic states are shown. The box represents the interquartile range that contains 50% of the values. The line across the box indicates the median. The whiskers above and below the box indicate the 90th and 10th percentiles, respectively. The dots above and below the whiskers indicate the 95th and 5th percentiles, respectively. In the two control groups, increase in EMGgg in response to decrease in PN was significantly higher under the activated state compared with hypotonic state. Using activated state, the obese control group had a stronger EMGgg response compared with the obese OSAS and lean control groups.
