
Figure 5.
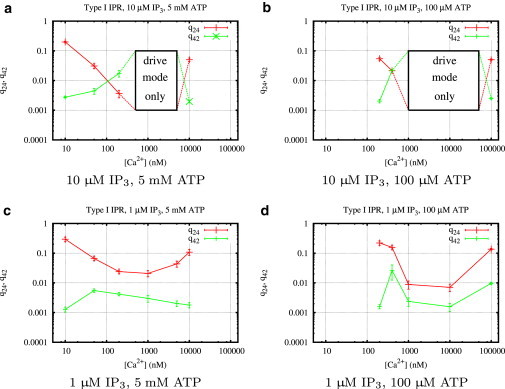
Calcium regulation of the transition rates q24 and q42 (Fig. 3) of type I IP3R for different concentrations of IP3, ATP, and Ca2+. Mean values and standard deviations of the transition rates were calculated from histograms (see Fig. 4 for an example) obtained from fits using the MCMC algorithm described in Section 1.4 of the Supporting Material.