
Figure 9.
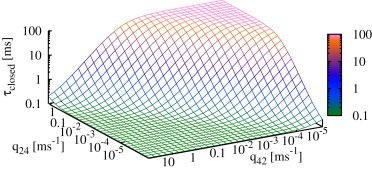
Expected closed time of the IP3R (see Eq. 8) depends on both transition rates, q24 and q42. It clearly shows that reaches a minimum if the tendency to switch to drive is high (low q24, high q42), whereas closed times increase for high q24 and low q42. This plot shows the results for type I IP3R; the type II IP3R results are similar.