
Figure 1.
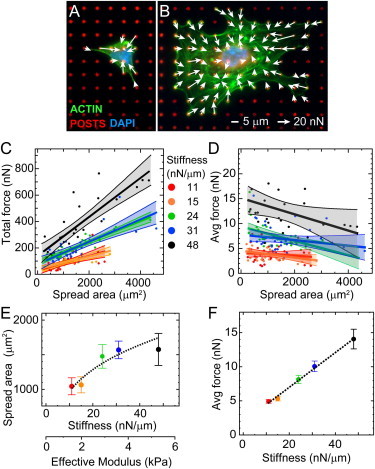
Traction forces of HPAECs versus spread area and substrate stiffness. (Color online) (A and B) Representative fluorescent micrographs and traction forces are shown for HPAECs on arrays of microposts with a spring constant of (A) k = 24 nN/μm and (B) k = 48 nN/μm (blue: DNA; green: actin; red: microposts). Traction forces were measured by analyzing the deflections of the posts, and reported as a force vector (arrows). (C) Total force increases with spread area for HPAECs on arrays with different post stiffness. (D) Average forces decrease with spread area. Each data point represents measurement from an individual HPAEC. Straight colored lines denote the linear least-squares fits to the data, and shaded regions report the 90% confidence interval for each fit. (E) Spread area versus substrate stiffness follows a power-law relationship (dashed line). (F) Average force versus substrate stiffness has a positive linear relationship (dashed line).