
Figure 11.
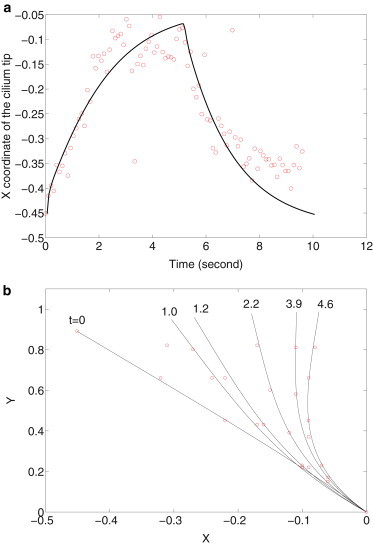
Comparison between model and experiment results shown in Fig. 8. Panel a plots the x-coordinate of cilium tip versus time, and panel b compares the cilium profiles at different times. The cilium length is 2.7 ± 0.5 μm and t = 0.
Official websites use .gov
A
.gov website belongs to an official
government organization in the United States.
Secure .gov websites use HTTPS
A lock (
) or https:// means you've safely
connected to the .gov website. Share sensitive
information only on official, secure websites.
Comparison between model and experiment results shown in Fig. 8. Panel a plots the x-coordinate of cilium tip versus time, and panel b compares the cilium profiles at different times. The cilium length is 2.7 ± 0.5 μm and t = 0.