
Figure 1.
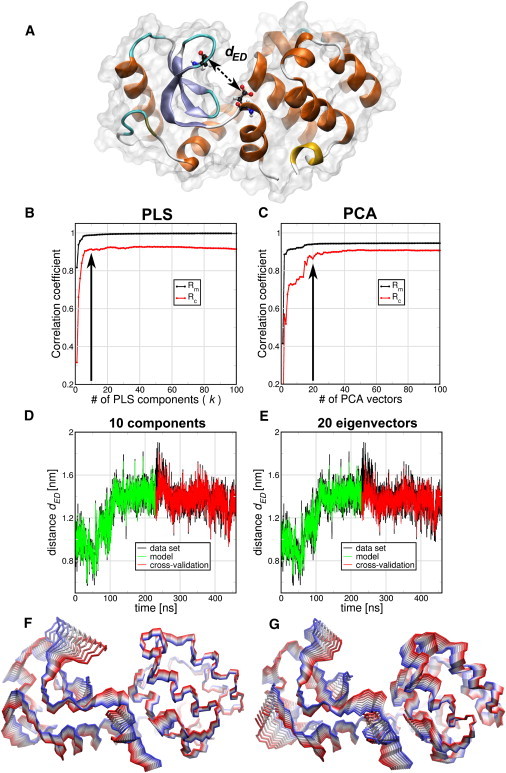
Comparison of PLS- and PCA-based FMA methods for Glu11-Asp20 distance dED (A) of T4 Lysozyme (T4L). (B and C) Pearson correlation coefficients between data and model for PLS- and PCA-based FMA as function of the number of PLS components or PCA vectors calculated for the model training subset (Rm) and the cross-validation subset (Rc). (D and E) (Overlay) Data and model for the calculated distances dED as function of time corresponding to the MD data, the training, and the model cross-validation subset. The models were calculated using 10 components for PLS-based FMA (D) and 20 PCA eigenvectors for PCA-based FMA (E). (F and G) Backbone representation of the ensemble-weighted MCM (ewMCM) contributing to the change in the distance dED. (Overlayed structures) Interpolation between the extremes of the ewMCMs. The PLS- and PCA-based FMA models used to plot the molecular representations have the same number of components or PCA vectors as the panels D and E.