
Figure 2.
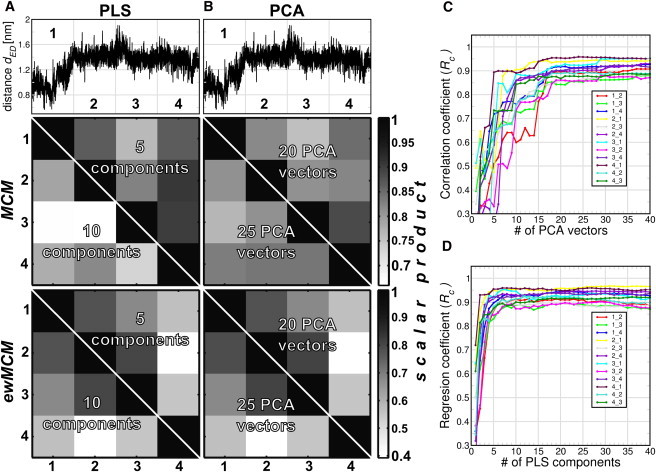
Scalar product analysis of PLS- and PCA-based FMA MCM and ewMCM models derived from different trajectory parts applied to the distance dED of T4 Lysozyme. (A and B) (Upper panels) T4L distance dED as function of time. The x axis is divided in four equally spaced subtrajectories. (Mid and lower panels) Scale-coded matrices of the scalar products of MCM and ewMCM vectors, respectively. Each (ew)MCM vector was calculated using one fourth of the T4L trajectory (as indicated in the upper panel). All the scalar product combinations were calculated for 5 and 10 components for PLS-based FMA, and 20 and 25 eigenvectors in the case of PCA-based FMA. Panels C and D show cross-validation correlation coefficients Rc as a function of the basis dimensionality. The indices of the form i,j mean that the model was constructed for fragment i and cross-validated with fragment j.