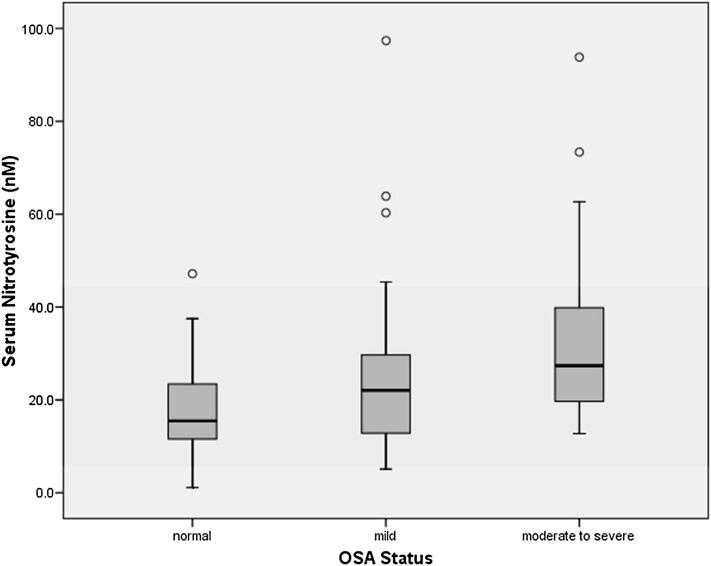
Figure 2.
The relationship between obstructive sleep apnea (OSA) and serum nitrotyrosine levels in patients with type 2 diabetes without OSA (n = 29) and with mild (n = 45) and moderate to severe OSA (n = 28). P value for the trend, P < 0.001. P = 0.04 for mild versus moderate to severe OSA. P < 0.001 for normal versus moderate to severe OSA. Normal: patients with type 2 diabetes but without OSA.

