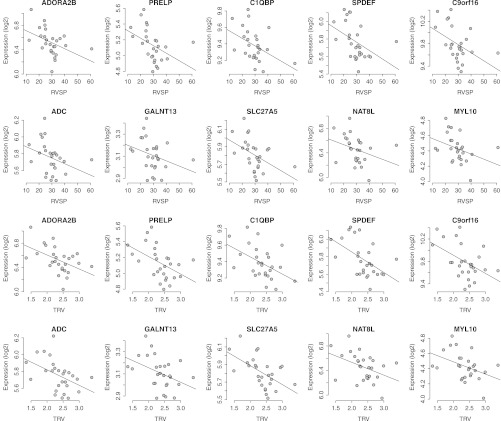
Figure 1.
Spearman correlation plot for genes within the signature for an elevated tricuspid regurgitation jet velocity (TRV). The correlation graphs depict the relationship between the expression values of the 10 signature genes plotted against either estimated right ventricular systolic pressure (RVSP) or TRV. These plots confirm the down-regulation of all 10 genes with increasing TRV or RVSP severity.

