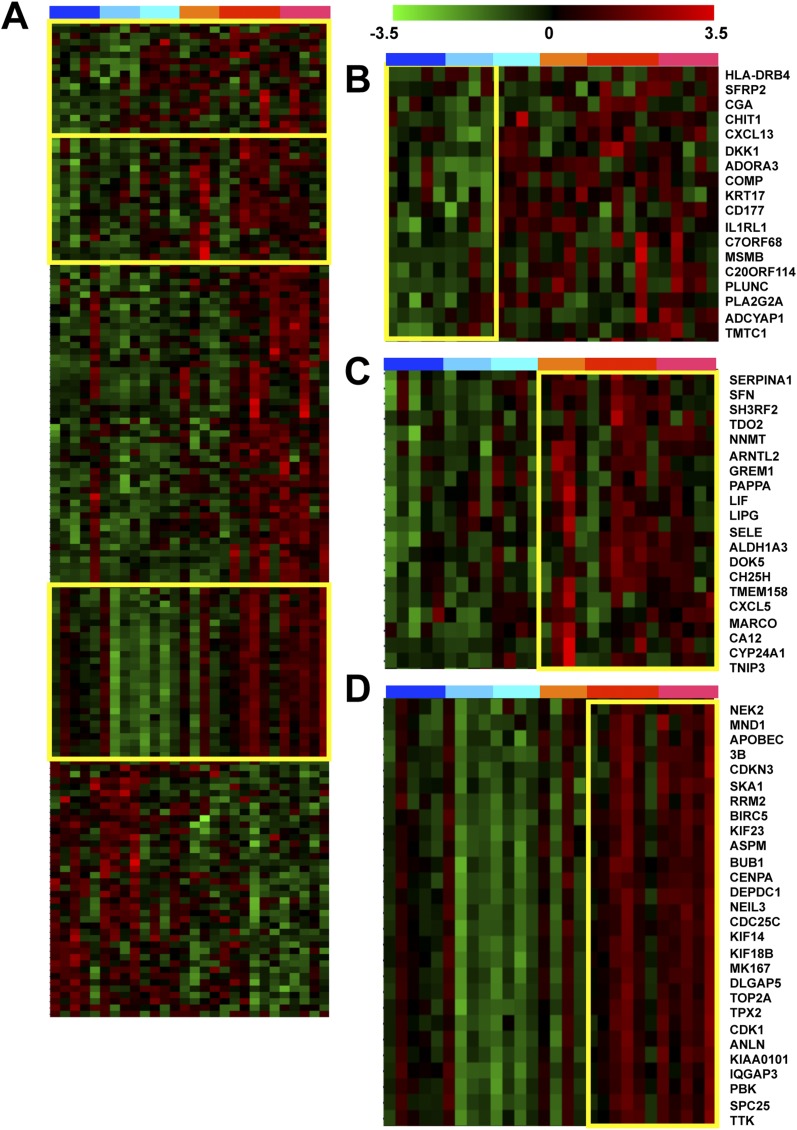
Figure 2.
Gene expression patterns in bronchopulmonary dysplasia (BPD) lungs. (A) Shown are gene expression patterns for a set of 159 genes significantly affected (P value < 0.05, fold change > 2) in BPD lung tissue as compared with controls. Columns represent individual subjects including (defined at bar on top); early gestation age control lungs (dark blue), late gestation control lungs (light blue), non-BPD lung injury (aqua), non-BPD injury with sepsis (orange), early gestation age BPD (red), and late gestation BPD (pink). Expression patterns for individual genes are in rows, with high expression levels in red and low expression levels in green, defined as indicated by the scale bar. Yellow boxes indicate areas represented in B–D. (B) As in A, highlighting a set of genes affected in both BPD and in general injury samples (including sepsis). (C) As in A, highlighting a set of genes affected in both BPD and sepsis-associated samples only. (D) As in A, highlighting a set of genes whose expression is associated with gestational age in control subjects but not in subjects with BPD.

