Figure 2.
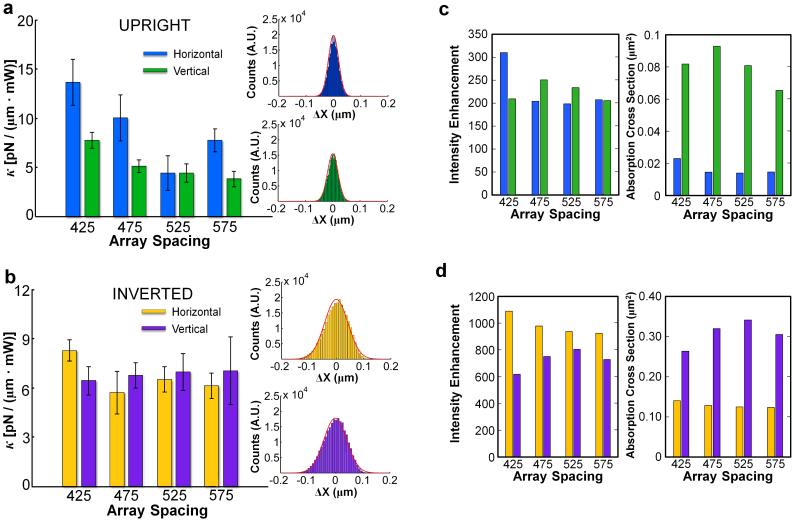
Experimentally measured trap stiffness for the (a) upright BNA orientation and (b) the inverted BNA orientation. Error bars represent the standard deviation in the stiffness measurement. The insets are representative particle displacement histograms measured on the 425 array and fitted to a Gaussian distribution. Blue bars correspond to stiffness measurements using horizontal-input polarization whereas green bars correspond to vertical-input polarization. FDTD calculations of the intensity enhancement and absorption cross-section for the (c) upright BNA orientation and the (d) inverted orientation. Yellow (purple) bars are results for horizontal (vertical) polarization.

