Figure 3.
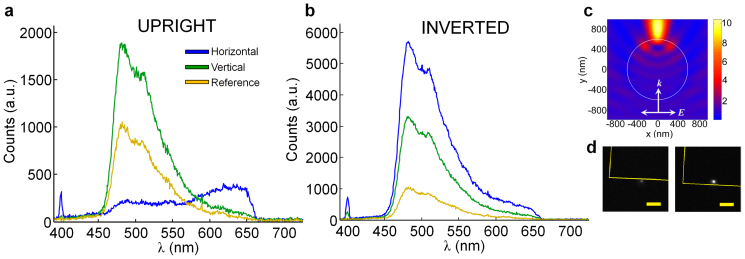
Two-photon fluorescence measurements from a trapped fluorescent microsphere on the 425 array with 50 µW input power in (a) the upright orientation and (b) the inverted orientation. Blue and green curves represent the horizontally and vertically-polarized results, respectively. The reference signal (given in yellow) is from a particle attached to the glass substrate in 3(a) and a free particle forced up against the substrate in 3(b). (c) FDTD simulation of the scattered intensity of a plane-wave illuminated 1.2-µm diameter polystyrene sphere in water which leads to the particle “lensing” effect. The outline of the particle is shown as the white circle. (d) CCD frames showing the single particle fluorescence in the inverted orientation for the reference (left) and on the 425 array (right). The array outline is sketched in yellow and the scale bar is 5 µm.

