
Figure 2.
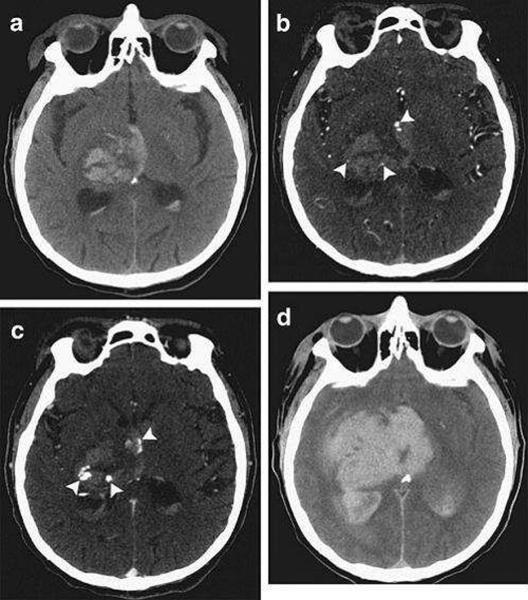
Computed Tomography (CT) and CT angiography of acute intracerebral hemorrhage. (A) Noncontrast CT shows a right thalamic intracerebral hemorrhage (24mL) with associated intraventricular hemorrhage (6mL). (B) CT angriography demonstrates 3 foci of contrast (spot signs) within the intracerebral hemorrhage (arrowheads) (C). Delayed CT angiography shows increased volume and changed morphology of the spot signs (arrowheads). (D) Noncontrast CT after 8 hours demonstrates expansion of the intracerebral hemorrhage (94ml) and intraventricular hemorrhage (82 mL). (Reproduced from [32])