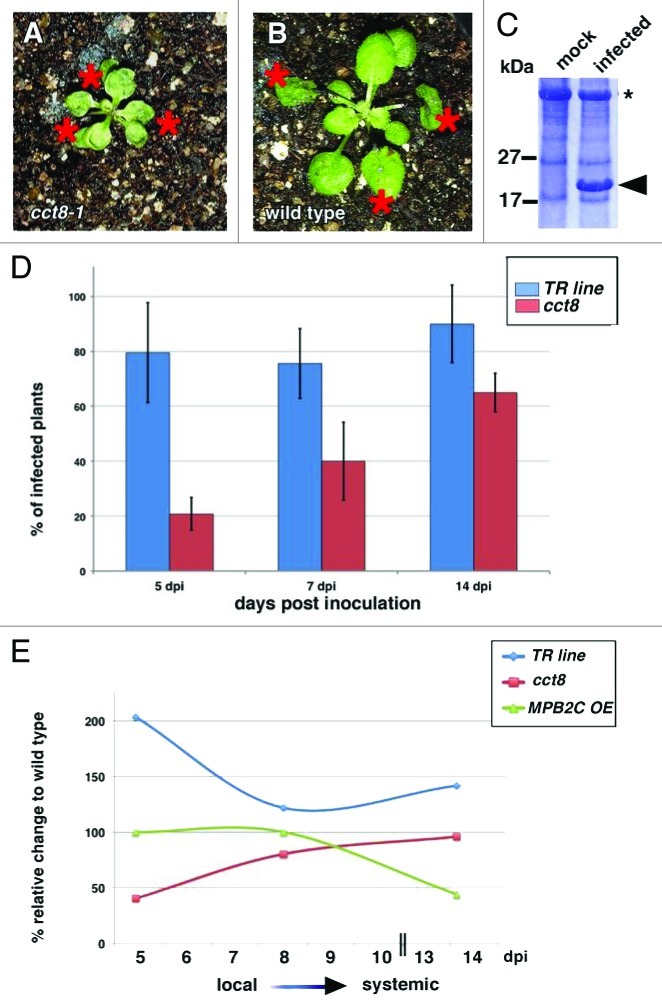
Figure 1.
ORMV infection experiments. (A) and (B) inoculated wild-type (A) and cct8–1 mutant plant (B). Inoculated leaves are marked with an asterisk. (C) Representative Coomassie stained 10% polyacrylamide gel showing the presence of the ORMV coat protein in infected plants. Mock: buffer inoculated plant. Infected: viral coat protein band is marked with an arrowhead. (D) Percentage of infected TR parent and cct8-1 mutant plants harvested at different time points after infection. (E) Infection rates of TR parent, cct8-1 mutant, and MPB2C overexpression (OE) plants in comparison to the wild-type infection levels.

