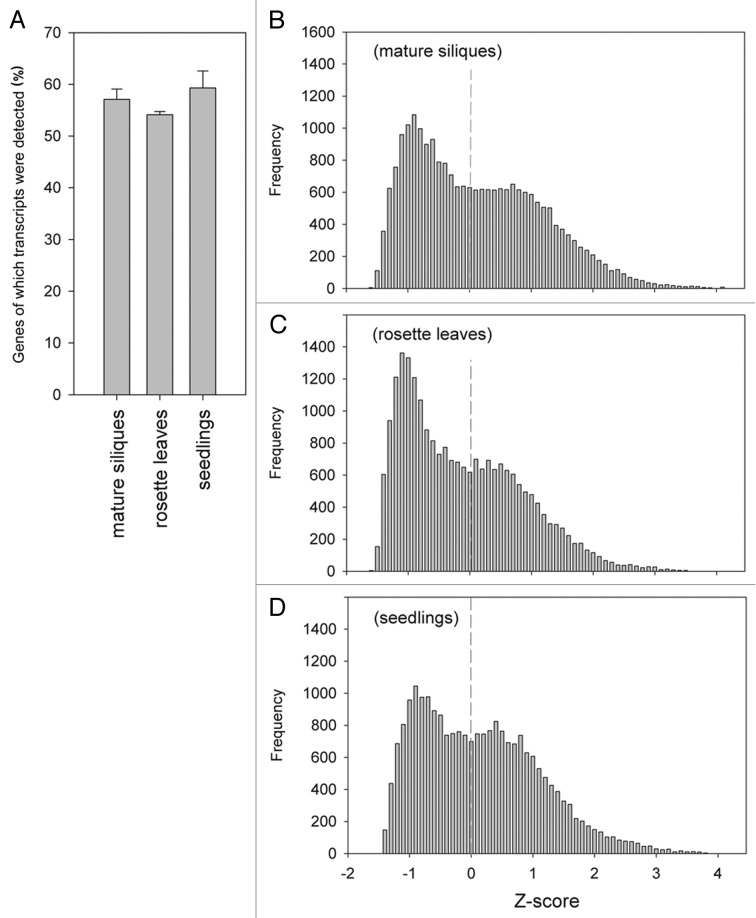
Figure 2.
Comparison of transcriptomics data between diverse plant tissues. (A) Fraction of genes for which transcripts were detected (% of probe sets with detection p value < 0.05) in different tissues of Ler wild-type. Siliques were harvested at 18–19 DAP13 and rosette leaves and seedling data were obtained from publicly available microarray data NASCArray ID: affymetrix.arabidopsis.info/narrays/experimentpage.pl?experimentid = 327 and GEO (www.ncbi.nlm.nih.gov/geo/query/acc.cgi?acc=GSE911), respectively. Error bars represent SE (B–D) Histograms of relative expression levels (Z-scores) of (B) siliques at 18–19 DAP, (C) rosette leaves and (D) seedlings. Note that the average expression level is X = 0 and is shown as a dashed line.

