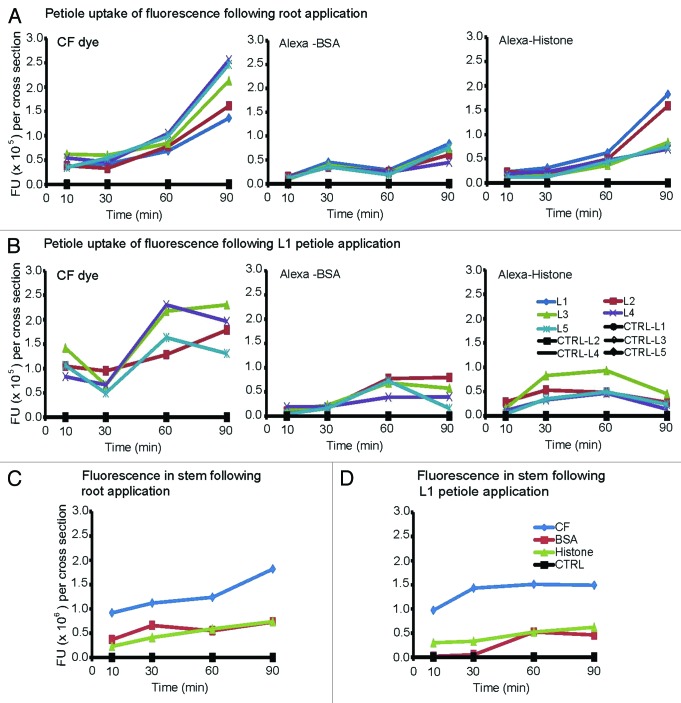
Figure 5.
Fluorescence intensity of petiole cross sections of B. oleracea plants which were transferred to hydroponic medium. Graphs depict the average fluorescence values in the vascular bundles of (n = 4) petiole or stem cross sections. The fan-shaped and circular vascular bundles were selected as ROIs using Image J software and fluorescence values were recorded. The data were collected at 10, 30, 60 and 90 min after application of CF dye, Alexa-BSA or -Histone.

