Figure 7.
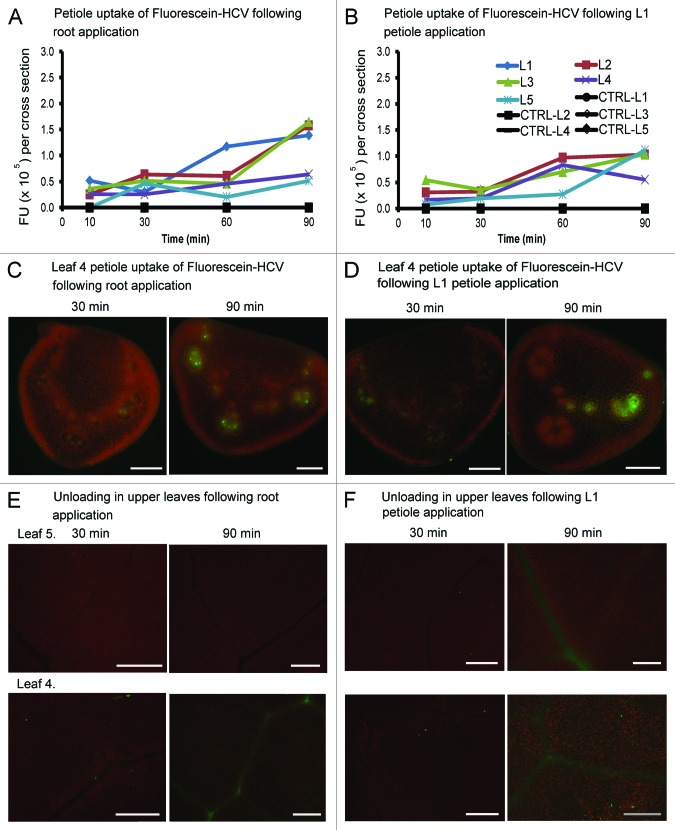
The uptake of fluorescein-HCV core antigen by B. oleracea petioles and leaves. (A and B) Graphs depict the average fluorescence values in petiole cross sections. The fan-shaped and circular vascular bundles were selected as ROIs using Image J software and fluorescence values were recorded. The data were collected at 10, 30, 60 and 90 min after application of Ffluorescein-HCV. (C and D) Petiole uptake of Fluorescein-HCV following L1 petiole delivery. Images of L4 petiole cross sections of B. oleracea following L1 petiole (A) or root (B) application at 30 and 90 min. Bars = 500 μm. (E and F) Leaf vascular pattern in L4 source/sink transition leaf or L5 sink leaf. Images were taken at 30 or 90 min following root or petiole application of fluorescent markers. Bars = 500 μm.

