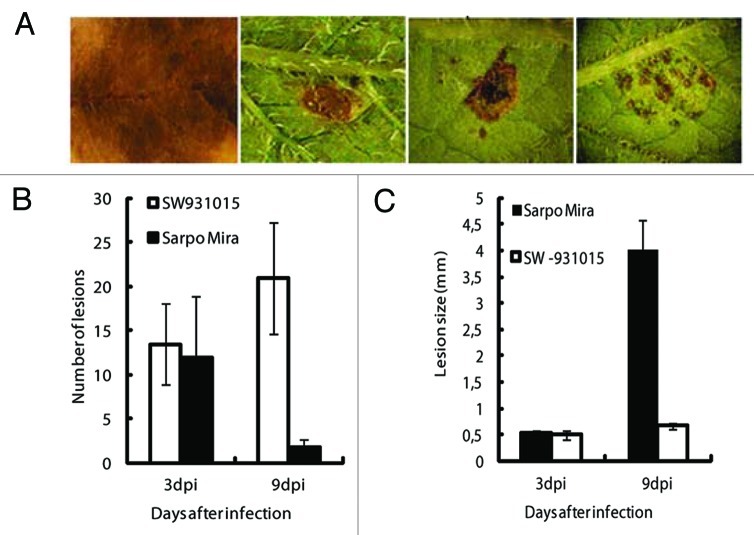
Figure 2. Detached leaf assay showing infection lesion or resistance reaction HR against P. infestans. (A) Desiree showing necrosis after infection, while S. demissum, Sarpo Mira and SW93-1015 displayed HR at 9 dpi. (B) Graph showing number of lesions formed per leaf on Sarpo Mira and SW93-1015 at 3 and 9 dpi. Error bars indicate standard deviation of the mean. (C) Graph showing mean size of lesions on Sarpo Mira and SW93-1015 at 3 and 9 dpi. Error bars indicate standard deviation of the mean.

An official website of the United States government
Here's how you know
Official websites use .gov
A
.gov website belongs to an official
government organization in the United States.
Secure .gov websites use HTTPS
A lock (
) or https:// means you've safely
connected to the .gov website. Share sensitive
information only on official, secure websites.
