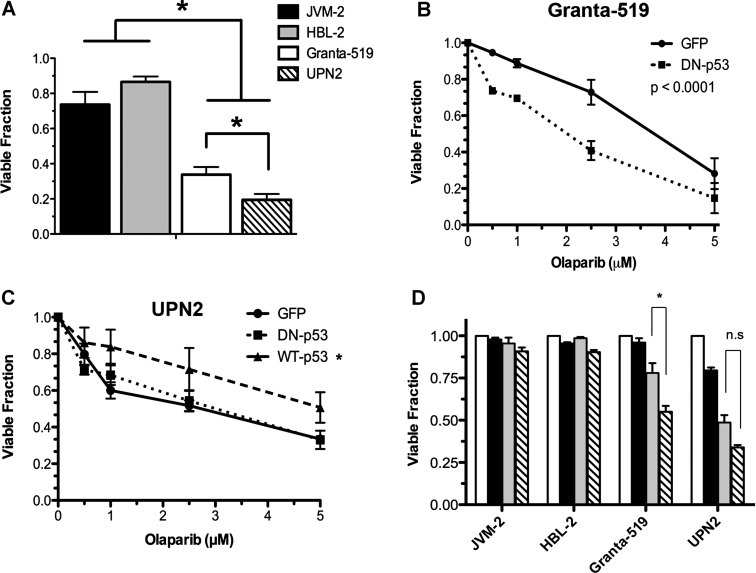
MCL cell lines JVM-2 (black), HBL-2 (grey), Granta-519 (white) and UPN2 (hatched) cells were exposed to 5 µM olaparib for 96 h prior to determining cellular viability by trypan blue exclusion. Viability was normalized to DMSO treated controls for each individual cell line. Results were analysed by Student's t-test, where n = 6 for JVM-2, 5 for Granta-519, 6 for HBL-2 and 4 for UPN2. Error bars represent SEM. p-Values were 0.0408 for Granta-519 compared to UPN2, 0.0016 for JVM-2 compared to Granta-519 and <0.0001 for JVM-2 compared to UPN2 and HBL-2 compared to UPN2. Asterisks indicate p < 0.05.
Granta-519 cells were transfected with either DN-p53 (dotted line) or GFP vector (solid line). Olaparib was added 24 h post transfection and cellular viability was determined by trypan blue exclusion following 96 h of exposure to increasing concentrations of olaparib. Results were analysed by two-way ANOVA, n = 3, error bars represent SEM, p < 0.0001.
UPN2 cells were transfected with DN-p53 (dotted line), WT p53 (dashed line) or GFP vector (solid line), prior to exposure to increasing concentrations of olaparib and assayed as in panel B. Results were analysed by 2-way ANOVA, n = 3, error bars represent SEM, the p-value for GFP-vector compared to WT p53 was 0.0006, and for DN-p53 compared to wt-p53, 0.0023. p-Values <0.05 were considered statistically significant and marked by an asterisk.
-
JVM-2, HBL-2, Granta-519 and UPN2 cells were exposed to either DMSO (white bars), pifithrin-α (black bars; 50 µM), olaparib (grey bars; 2.5 µM) or both pifithrin-α and olaparib (hatched bars; at 50 and 2.5 µM, respectively), for 96 h prior to determining cell viability as in panel A. Viability was normalized to DMSO treated controls for each cell line. Results were analysed by Student's t-test, n = 3, p-values were 0.0145 for Granta-519 and 0.0831 for UPN2.
Comparisons were considered statistically significant when p < 0.05 and are marked by an asterisk. Results that were not considered statistically significant are indicated by n.s.

