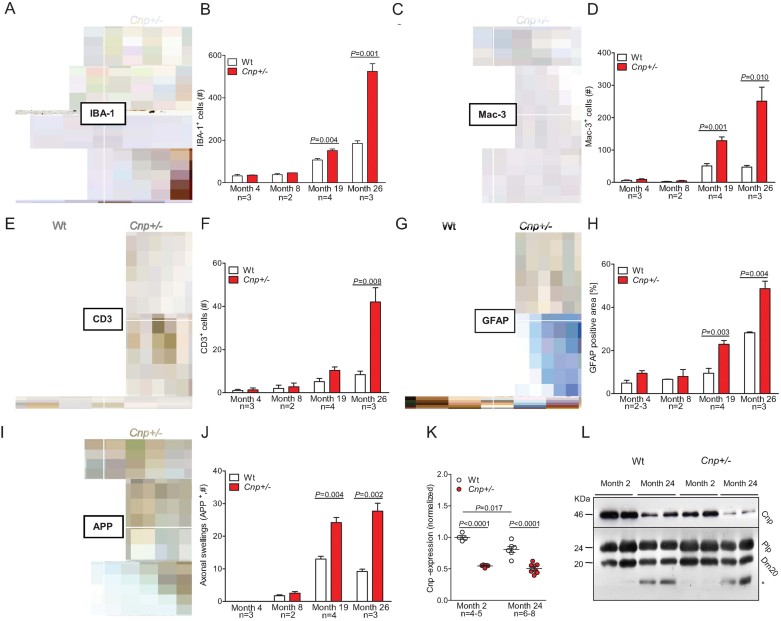
Representative microscopic images of the corpus callosum from 4 months (upper panels) and 26 months (lower panels) old Wt and Cnp+/− mice, immunostained for IBA-1; scale bar 20 µm.
Bar graph gives the age-dependent quantification of the total number of IBA-1 positive microglia in the corpus callosum of Wt and Cnp+/− mice. For all quantifications (B, D, F, H, J), n numbers indicated; mean ± s.e.m. presented; two-sided Student's t-test used.
Representative microscopic images of the corpus callosum from 4 months (upper panels) and 26 months (lower panels) old Wt and Cnp+/− mice, immunostained for Mac-3; scale bar 20 µm.
Bar graph gives the age-dependent quantification of the total number of Mac-3 positive microglia in the corpus callosum of Wt and Cnp+/− mice.
Representative microscopic images of the corpus callosum from 4 months (upper panels) and 26 months (lower panels) old Wt and Cnp+/− mice, immunostained for CD3; black arrows exemplify respective positive cells; scale bar 20 µm.
Bar graph gives the age-dependent quantification of the total number of CD3 positive T-lymphocytes in the corpus callosum, striatum and anterior commissure of Wt and Cnp+/− mice.
Representative microscopic images of the corpus callosum from 4 months (upper panels) and 26 months (lower panels) old Wt and Cnp+/− mice, immunostained for GFAP; scale bar 20 µm.
Densitometrical quantification of the GFAP positive area in the corpus callosum.
Representative microscopic images of the striatum from 4 months (upper panels) and 26 months (lower panels) old Wt and Cnp+/− mice, immunostained for APP; black arrows exemplify respective positive cells; scale bar 20 µm.
Bar graph gives the age-dependent quantification of the APP positive axonal swellings in the corpus callosum, striatum and anterior commissure of Wt and Cnp+/− mice.
Cnp mRNA expression level of Wt and Cnp+/− mice at months 2 and 24, normalized to mean value of ATP synthase subunit beta (Atp5b) and acidic ribosomal phosphoprotein P0 (Rplp0) as housekeeper genes and to 2 months old Wt (1.0); mean ± s.e.m. presented; two-sided Student's t-test used.
Cnp protein expression of Wt and Cnp+/− mice at months 2 and 24, compared to Plp as control protein of compact myelin; * low-size band detected in aged brain myelin with the Plp antibody directed against the C-terminus of PLP/DM20.

