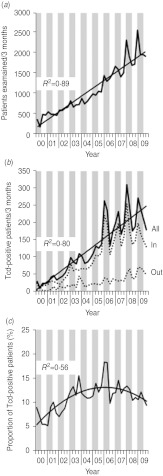
Fig. 1.
C. difficile infections in Southern Germany (Bavaria) per 3 months between 2000 and 2009. Stool samples were examined at the Synlab Medical Care Center Weiden. Grey vertical bars represent winter (January–March) and spring (May–June) quarters; white vertical bars indicate summer (July–September) and autumn (October–December) quarters. (a) Number of patients examined for C. difficile toxin (Tcd) carriage. (b) Number of Tcd-positive patients. All=number of Tcd-positive inpatients (In) and outpatients (Out). (c) Proportion of Tcd-positive patients.

