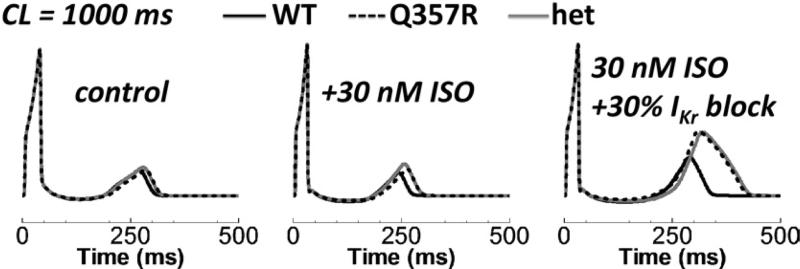
Figure 6.
Effects of ISO and IKr reduction on the pseudo-ECG. The simulated pseudo-ECG is plotted by using a shared, normative scale. On the left, middle, and right, the cases of control, ISO, and 30% IKr block plus ISO are shown. CL = cycle length; ECG = electrocardiogram; het = heterozygous; ISO = isoproterenol; WT = wild type.

