
Figure 1.
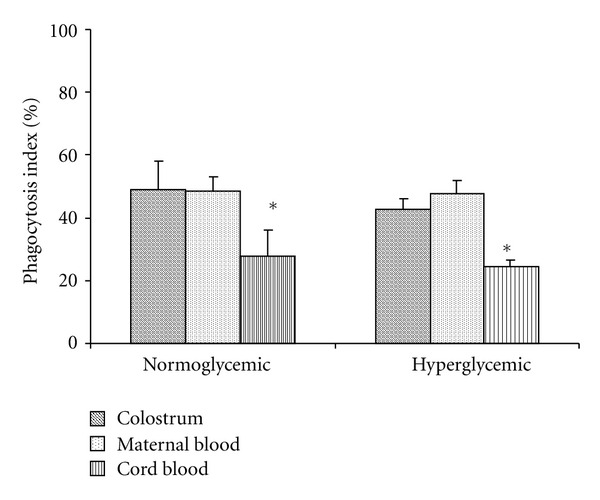
Mean (±SD) phagocytosis index of colostrum, maternal, and cord blood MN cells (N = 10) determined using the acridine orange method. *Indicates statistical difference (P < 0.05) within normo- and hyperglycemic groups.
Official websites use .gov
A
.gov website belongs to an official
government organization in the United States.
Secure .gov websites use HTTPS
A lock (
) or https:// means you've safely
connected to the .gov website. Share sensitive
information only on official, secure websites.
Mean (±SD) phagocytosis index of colostrum, maternal, and cord blood MN cells (N = 10) determined using the acridine orange method. *Indicates statistical difference (P < 0.05) within normo- and hyperglycemic groups.