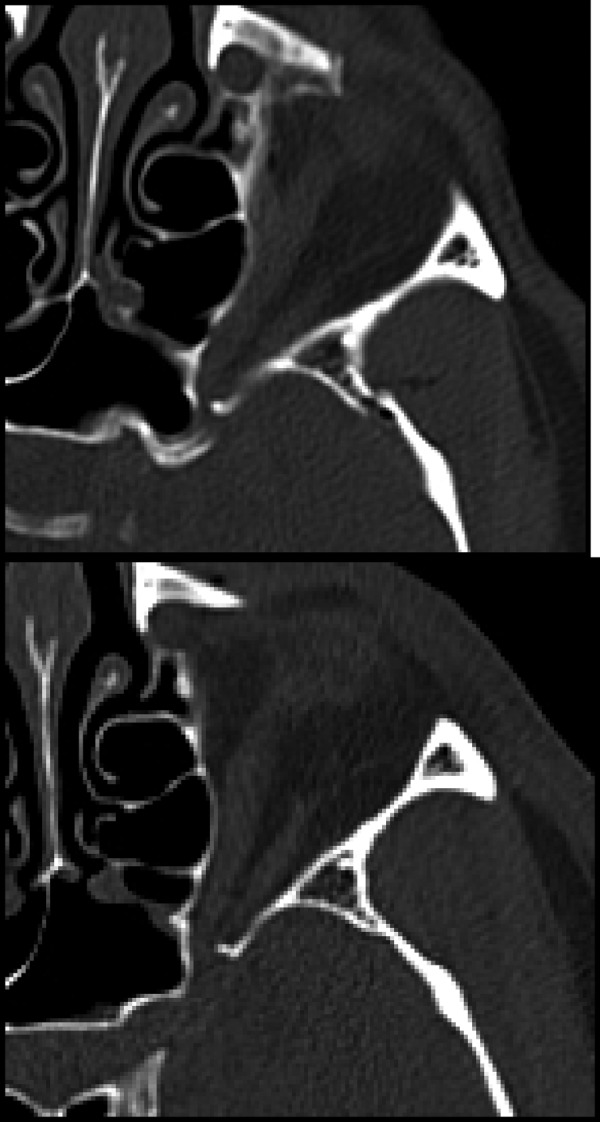
Figure 6.

Comparison of the pre- and postoperative maxillofacial computed tomographic scans. Both images are axial cuts, bony windows, at the approximate level of the superior orbital fissure. Note the second image demonstrating widening of the superior orbital fissure, verified by radiological report, with decreased bony compression and excellent reduction of the fracture segment.
