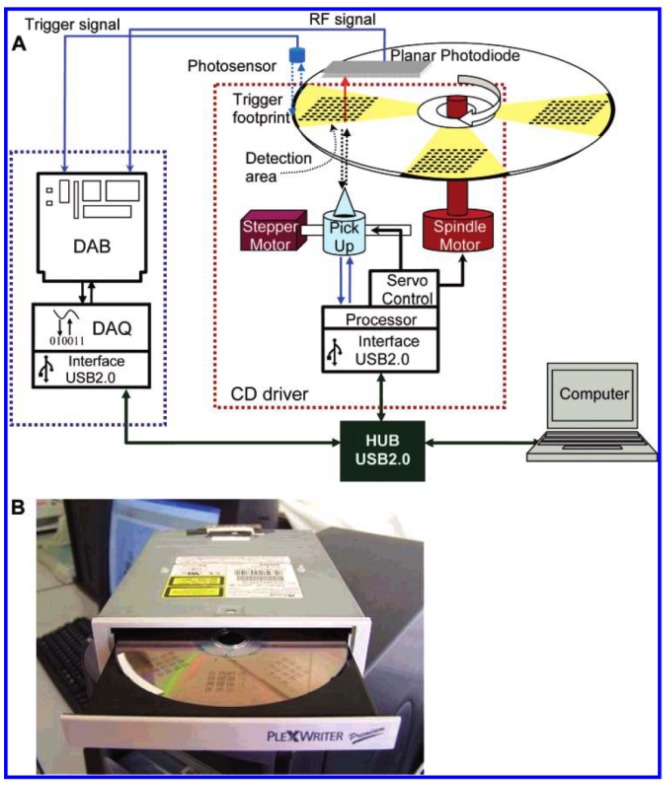
Figure 2.
(A) Schematic representation of the detection system. In the blue dashed outline: DAB, DAQ and mMachine interface, and in the red dashed outline: CD drive system, power section and processor; (B) Picture of the CD player used in this work (modified from [63] © 2007 American Chemical Society).

