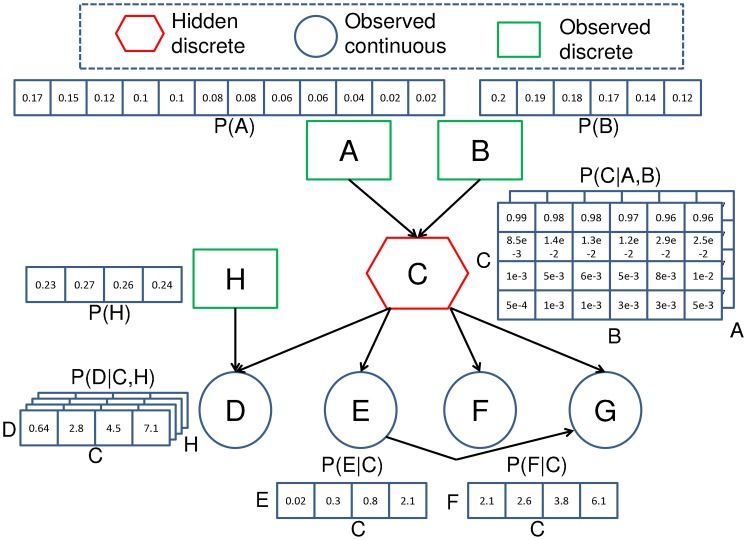
Figure 1.
A Bayesian network is a directed acyclic graph representing the joint probability of a problem. Each node in the network is associated with a conditional probability distribution of a variable that is conditioned upon other variables with edges pointing towards it. This particular network structure is used to assess the data quality of temperature and conductivity sensors deployed in Sullivans Cove, Hobart with cause and observed evidence tests. The causes of sensor degradation include the time since the sensor was calibrated (node A) and the time since the sensor was cleaned (node B). Node C was used to infer the latent quality state. The observed evidence of the data quality was the seasonal difference (node D), the gradient (node E), the difference between the sensor and hydrodynamic model (node F) and the difference between equivalent sensors at alternate depths (node G). The CPD of the network have been trained from observations of a temperature sensor deployed at 1m in Sullivans Cove.

