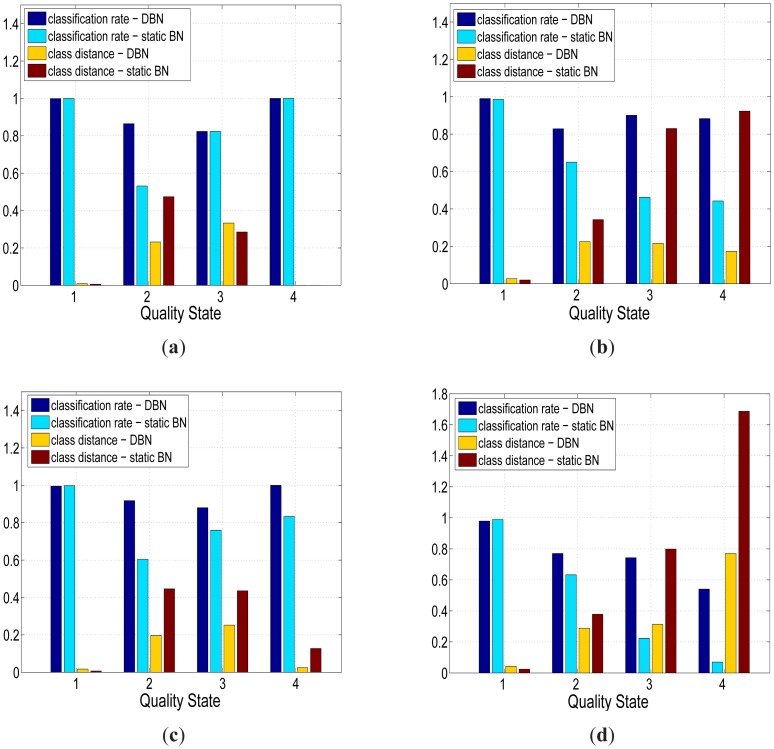
Figure 6.
The automated quality assessments from two BN (static BN and DBN) compared to expert quality assessments across the four sensors in Sullivans Cove, Hobart. The quality state labels 1 to 4 define the quality states in Table 1. There were two metrics used to compare the assessment performance of the Bayesian networks. The first metric was the distance between the quality state with maximum posterior probability and the quality state selected by an expert. The second metric was the distance between the expert's quality state and the continuous quality label of the network defined in Equation (11). (a) Temperature Sensor at 1 m; (b) Conductivity Sensor at 1 m; (c) Temperature Sensor at 10 m; (d) Conductivity Sensor at 10 m.

