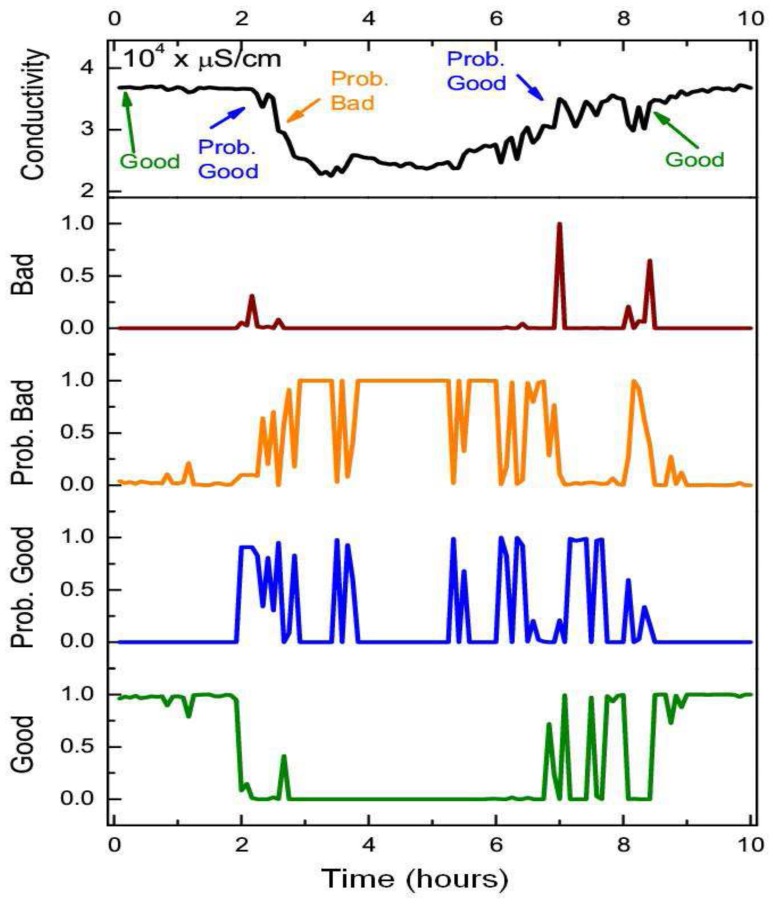
Figure 8.
The top time-series of each figure corresponds to a section of sensor readings from the conductivity sensor at 1 m that have been assessed by a human expert and automatically flagged by the static BN. The four bottom series correspond to the posterior probabilities of the (between 0–1) quality states of each sensor sample in the network. The arrows upon the top time-series correspond to the points at which the expert's assessment has changed to the quality state specified.

