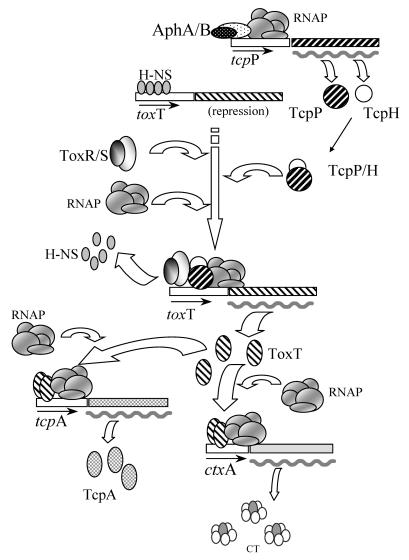
FIG. 1.
Schematic representation of the genetic regulatory cascade controlling CT expression. From top to bottom the diagram shows activation of tcpP by AphAB, basal repression of toxT by H-NS, activation of toxT by TcpP-TcpH and ToxR-ToxS with displacement of H-NS, activation of tcpA and ctxA by ToxT, and synthesis of TcpA and CT. Different patterns indicate the various regulators. RNAP, RNA polymerase. Small arrows beneath boxes indicate promoters, as well as the direction of transcription. A wavy thick line indicates mRNA and thus indicates transcriptional activation. Additional potential basal repression of tcpA and ctxA by H-NS (24, 33) is not shown.

