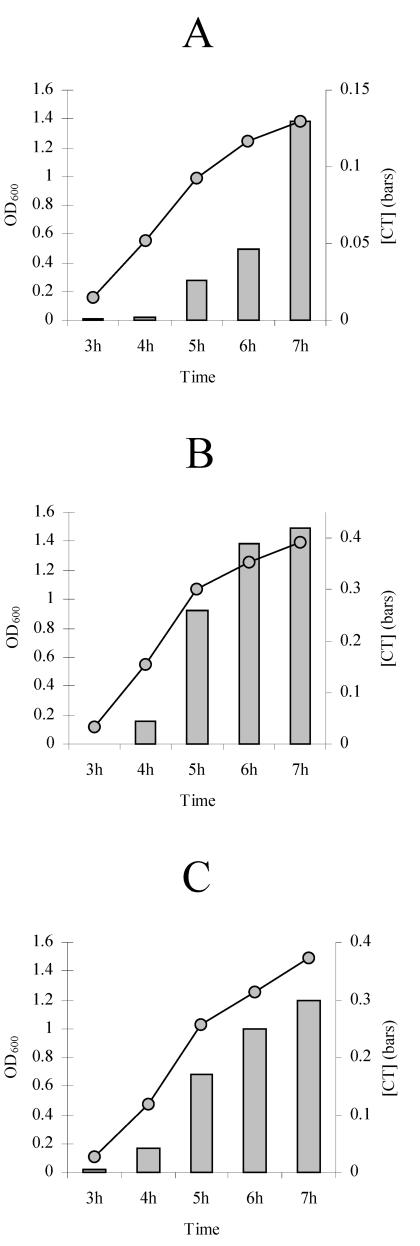
FIG. 3.
Time course of expression of CT with a large exposed culture surface when different atmospheres were used. (A) Expression under air; (B) expression under nitrogen; (C) expression under helium. A constant volume of 3 ml in a 125-ml flask was used in all cases. Individual cultures were used for each of the sample times. The incubation time is plotted on the x axis. The concentration of CT (in micrograms per milliliter) is plotted on the right y axis. The OD600 of the culture is plotted on the left y axis.

