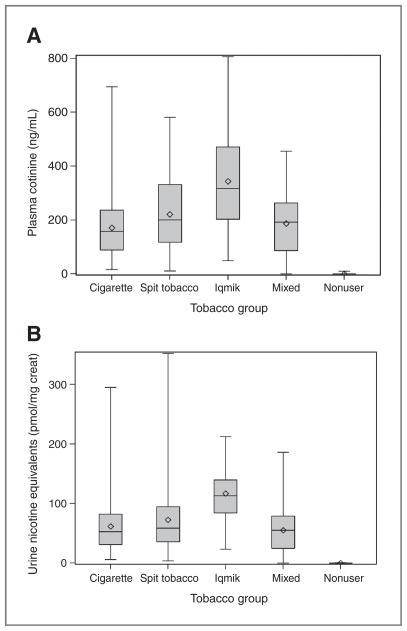
Figure 1.
Box and whisker plots of biomarkers of nicotine exposure in different tobacco use groups. A, plasma cotinine. B, urine nicotine equivalents. The solid line inside the box is the median, the diamond is the mean, the top and bottom of the box represent the 25% to 75% interquartile range, and the vertical line indicates minimum and maximum values.

