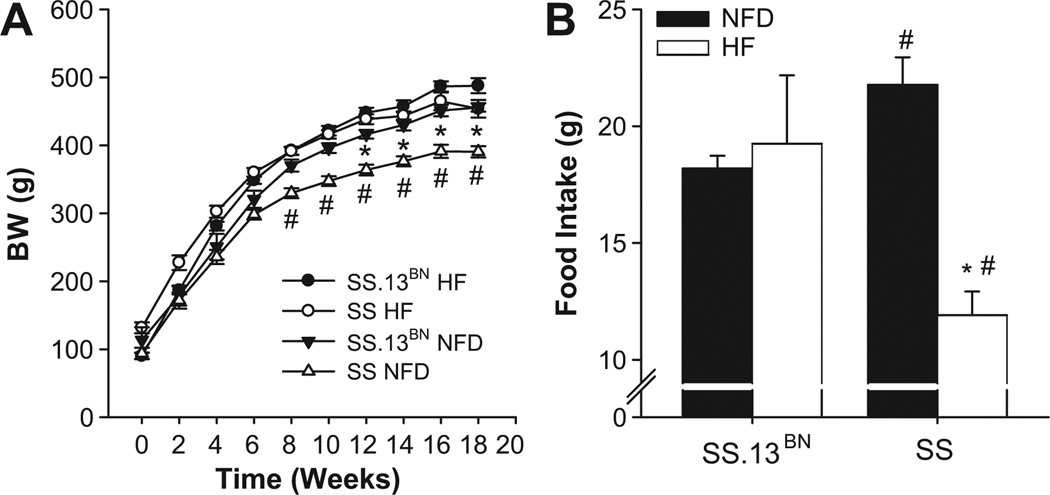
Figure 1.
Body weight progression and food intake of SS-13BN vs. SS rats fed high fat (HF) or normal fat diet (NFD) diet. Comparison of increase in body weights over the course of treatment with either high fat (HF) or normal fat (NFD) diet (A) and food intake in g/day (B). * P < 0.05 SS HF vs. NFD control. # P < 0.05 vs. SS-13BN on same diet. Data are expressed as mean ± SEM for n≥ 8.

