Figure 5.
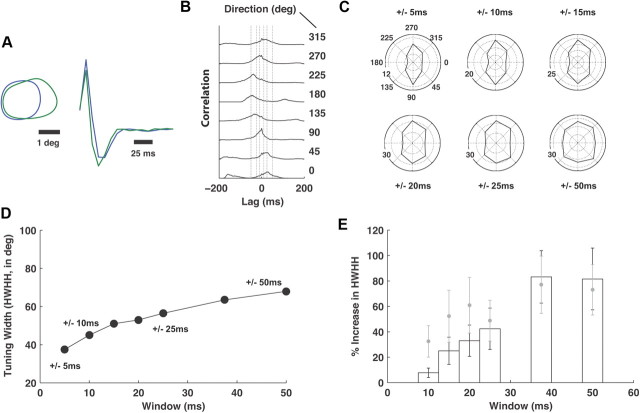
Effect of varying synchrony window. A, Spatial and temporal RF properties for an example pair, as in previous figures. B, Cross-correlation function for different directions of the drifting gratings. Vertical lines define windows of ±10, 25, and 50 ms. The blue and green cells of A had an average of 3392 and 1763 spikes per orientation, respectively. C, Joint tuning as a function of the window width (indicated above each polar plot). The radial scale shown in Hz. D, HWHH, in degrees, as a function of window width in milliseconds for the example pair in A–C. E, Percentage increase in the tuning width (HWHH) as a function of window width, relative to the HWHH corresponding to a ±5 ms window. Bars are the mean and the SEM, for 21 neuron pairs. In gray are the mean (symbols) and SEM (bars) of the tuning widths for the analysis at each window size, while excluding synchronous spiking within smaller windows (see Results).

