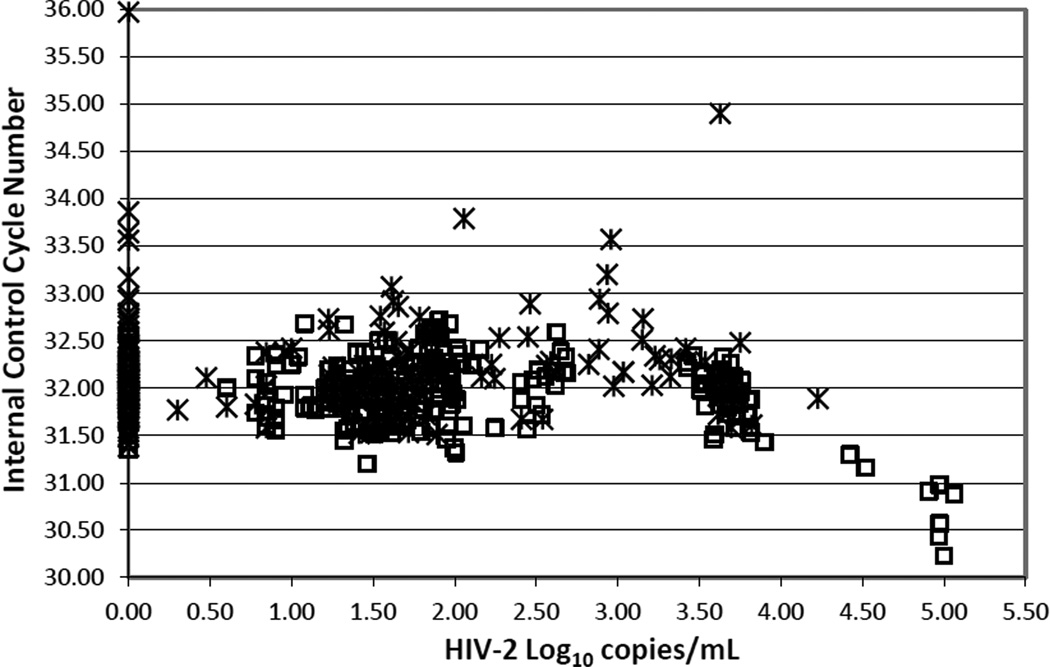
Figure 2.
HIV-2 viral loads in clinical plasma samples (crosses) and in HIV-2 NIH-Z and EHO standards (open squares) plotted against the corresponding cycle number (CN) for the internal RNA control. Clinical plasma samples included HIV-seronegative, HIV-seropositive, hepatitis B and hepatitis C– infected patients.

