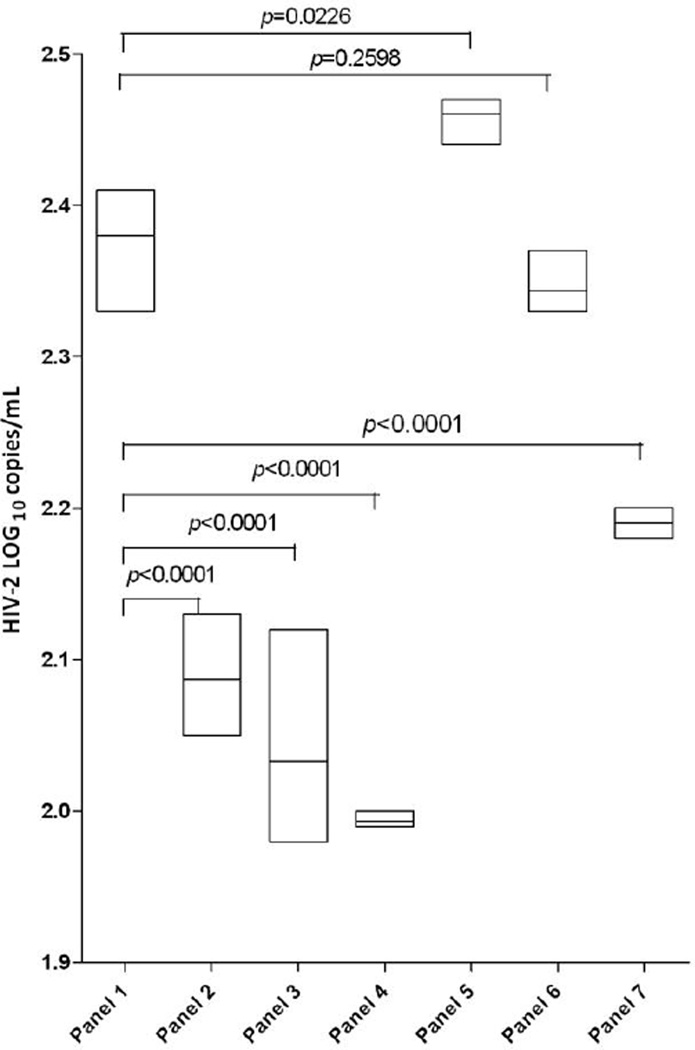
Figure 3.
Effect of interfering substances on measurements of HIV-2 RNA in plasma. Each box shows the highest, lowest and mean RNA values in triplicate samples. Panel 1, EDTA plasma; Panel 2, Hemolyzed plasma Low (0.5g/dL hemoglobin); Panel 3, Hemolyzed plasma Mid (1.0g/dL hemoglobin); Panel 4 Hemolyzed plasma Hi (1.95g/dL hemoglobin); Panel 5, Heparin plasma (19.85 USP/mL heparin); Panel 6, Lipemic plasma (785 mg/dL triglycerides); Panel 7, Icteric plasma (15mg/dL bilirubin). Mean RNA values were compared between the interfering substance and EDTA plasma using generalized linear models and Bonferroni corrections. A similar pattern of inhibition was observed for the IC CN for each panel (data not shown).

