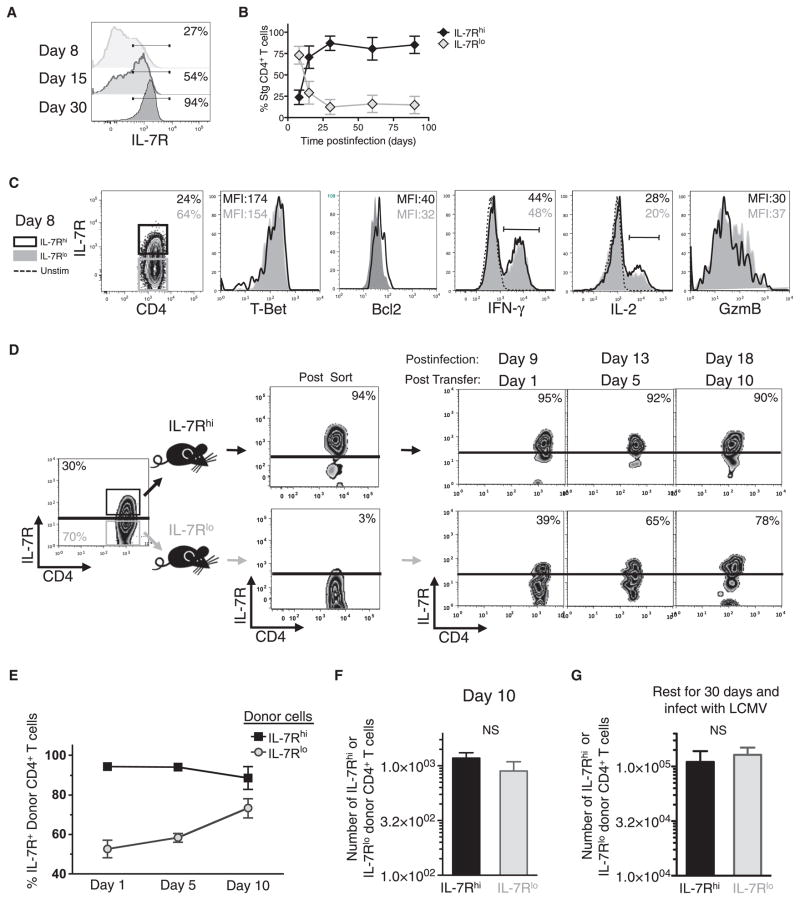
Figure 2. IL-7R Expression Does Not Mark Memory Precursor Effector CD4+ T Cells.
(A and B) Frequency of IL-7R on virus-specific CD4+ T cells was determined at various time points p.i. and shown in histogram plots (A) and in line graph ± SD (B).
(C) Expression of the indicated proteins was compared between IL-7Rhi (black line) and IL-7Rlo (gray shaded) Stg CD4+ T cells at day 8 p.i. and shown in overlapping histograms.
(D–F) IL-7Rhi (black) and IL-7Rlo (gray) Stg CD4+ T cells were purified by FACS 8 days p.i. and equal numbers were transferred into infection-matched congenic recipients. Donor cells in the blood were analyzed for IL-7R expression over 10 days posttransfer and the frequency of IL-7Rhi donor T cells are shown in representative FACS plots (D) or cumulative line graph ± SD (E).
(F) Bar graph shows the absolute number of donor cells + SD recovered 10 days posttransfer.
(G) As in (D) above, except the donor IL-7Rhi and IL-7Rlo effector T cells were parked for 30 days in naive congenic recipients that were subsequently infected with LCMV. Seven days after secondary infection, the number of donor Stg CD4+ T cells in the spleen + SD was measured.
Data are cumulative of three independent experiments. NS, not statistically significant.

