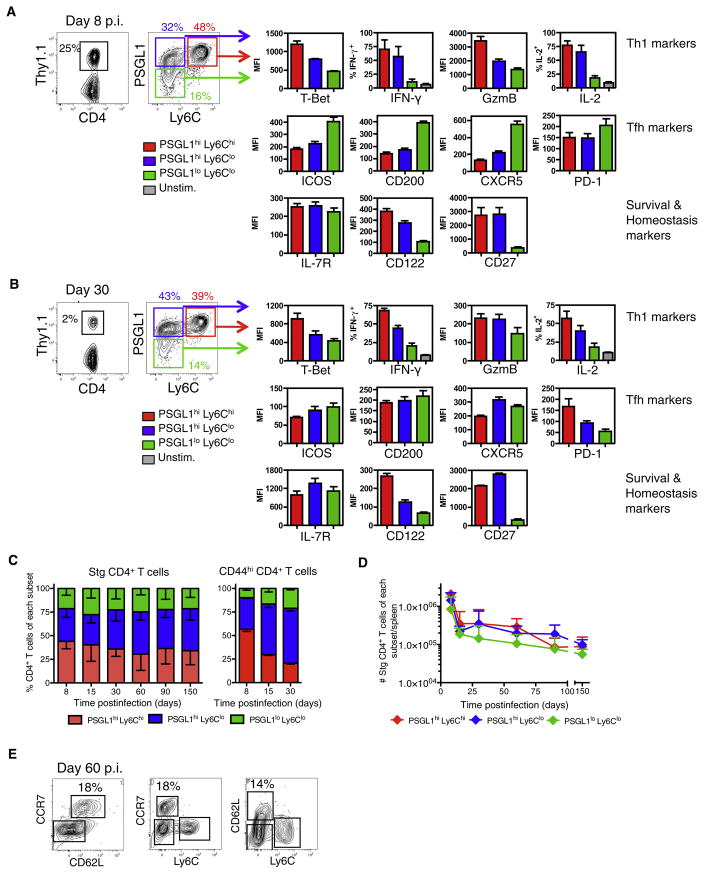
Figure 3. Formation of Distinct LCMV-Specific Effector CD4+ T Cells Subsets.
(A and B) Stg chimeric mice were infected with LCMV and 8 (A) or ~30 (B) days p.i. splenocytes were analyzed by flow cytometry for expression of the indicated proteins. PSGL1hiLy6Chi (red), PSGL1hiLy6Clo (blue), and PSGL1loLy6Clo (green) Stg CD4+ T cells were gated and the average MFI + SD for the various proteins are shown in bar graphs. CD4+ T cells were also stimulated with GP61–80 peptide in vitro and the average frequency of IFN-γ+ and IL-2+ Stg T cells + SD are shown.
Data shown are representative of three independent experiments (n = 3 per group).
(C) Stacked bar graph of Stg CD4 T cells (left) or CD44hi polyclonal CD4+ T cells (right) – SD in each subset after LCMV infection.
(D) Total number of Stg CD4+ T cells + SD of each subset during LCMV infection. Cumulative data from 9–37 mice/time point from more than 20 independent experiments are graphed.
(E) The expression of CD62L and CCR7 on Ly6Chi and Ly6Clo Stg CD4+ T cells at day 60 p.i. is shown in FACS plots. See also Figure S2.

