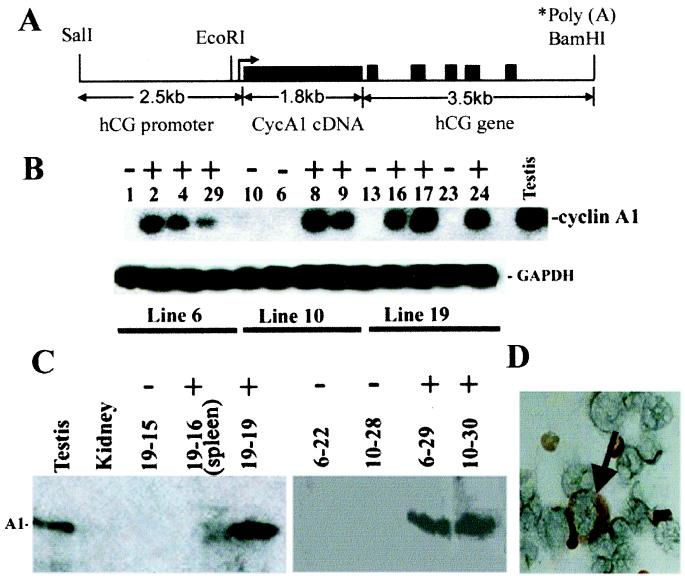
Figure 1.
(A) Diagram of the hCG/cyclin A1 transgene. The transcription start site is indicated with an arrow. The hCG sequences containing the promoter region extend upstream ≈2.4 kb from the start site. The large solid black box represents cyclin A1 cDNA and the small boxes represent the five exons of the hCG gene (≈3.5 kb, as noted); the polyadenylation signal is provided by the hCG gene. (B) RT-PCR analysis of bone marrow RNA from the indicated F1 transgenic mice (+) and nontransgenic controls (−) from three founder lines indicated below. Glyceraldehyde-3-phosphate dehydrogenase (GAPDH) was used as an internal control for RNA quality. (C) Immunoblot. Same amount of protein (≈200 μg) isolated from bone marrow and one sample from spleen (line 19, #16) of F1 transgenic (+) and nontransgenic littermate controls (−), as well as lysates from testis and kidney were loaded into each lane (founder line-mouse number). (D) Immunohistochemistry. Bone marrow cells from a 3-month-old transgenic mouse were incubated with antiserum specific for cyclin A1. The arrow indicates intensive staining of cytoplasm of an early myeloid cell.

