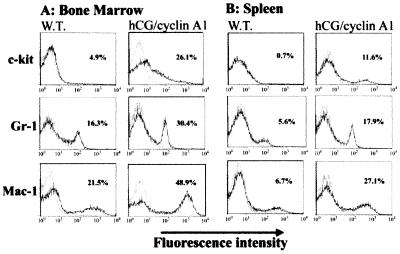
Figure 4.
FACS analysis of the cells isolated from the bone marrow and spleen of the transgenic mice and the littermate controls. Cells in suspension were stained with C-kit, Gr-1, and Mac-1, conjugated with fluorescein isothiocyanate (Gr-1) or R-phycoerythrin (C-kit and Mac-1), and are depicted by the solid lines. The control antibodies of the same isotype are displayed as dotted lines. The values in each histogram indicate the percent of cells in the population positive for the respective antibodies. The vertical axes indicate the relative cell counts (from 0 to 200) and the horizontal axes indicate the log fluorescence intensity.

