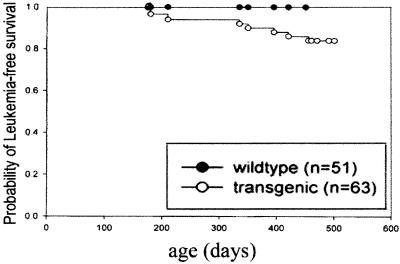
Figure 5.
Survival of hCG/cyclin A1 transgenic mice from founder lines 6, 10, and 19 compared with that of nontransgenic mice determined with Kaplan–Meyer plot. Survival at various time points was calculated on the basis of the size of each group of mice when an animal died or became terminally ill. The plot was generated by using Sigma Plot 2000 (SPSS Science, Chicago). The numbers (n) of transgenic and nontransgenic mice used for the analysis are shown on the right part of the graph.

