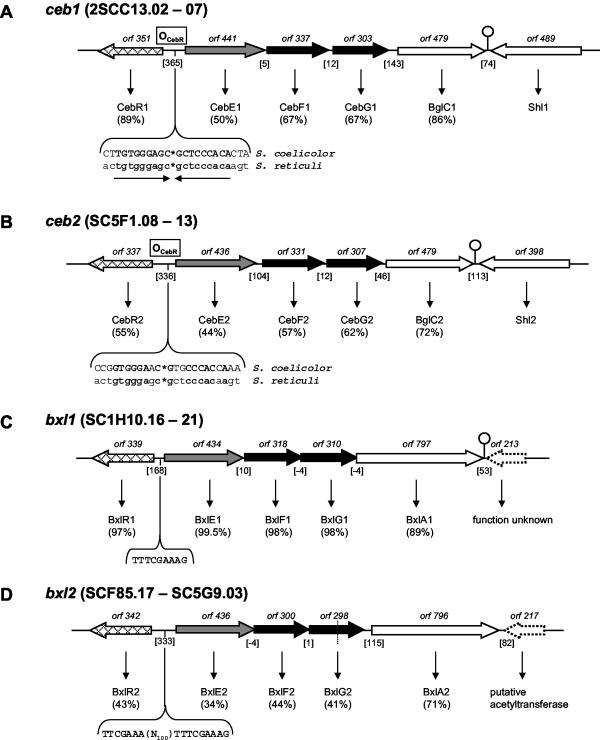
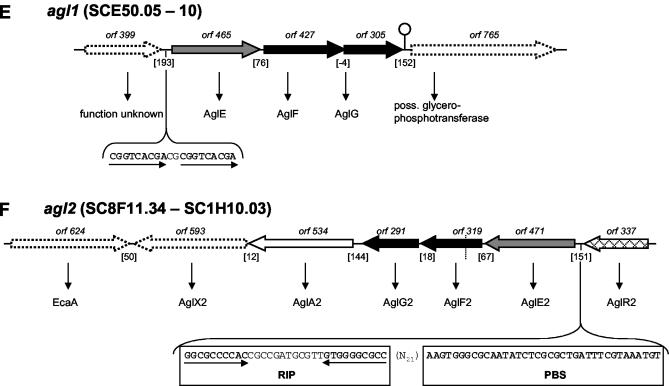
FIG. 2.
(A) ceb1 system. The depicted region includes six orfs, cebE1, cebF1, cebG1, bglC1, and shl1, comprising the ABC transport system and the first step of cellobiose utilization flanked by cebR1 and the probable secreted sugar hydrolase-encoding shl1. A palindromic region of 18 bp upstream of cebE1, shown to be part of the ceb operator (OCebR) in S. reticuli, was detected (the half-sites are separated by asterisks). ORF numbers denote the lengths of the gene products. Genes that encode membrane proteins (generally with the suffix F or G) are shown in black (membrane-spanning proteins); genes that encode substrate-binding proteins are shown in grey (with the suffix E). White arrows represent metabolic genes, probably functionally correlated to the respective system. Vertically striped arrows denote genes for ATP binding and/or hydrolyzing protein. Cross-hatched arrows indicate regulatory genes. Genes of unknown function and/or presumably not involved in the respective system are represented by dotted arrows. Putative regulatory elements are shown in uppercase type and boldface type where in consensus with comparable sequences or to emphasize direct or inverted repeats therein. Dyad repeats are drawn as a stem-loop sign. Dotted lines represent cosmid borders. The numbers of intergenic base pairs are given in brackets, the location of an ORF on the cosmid is designated by SCXX.nn, with “c” denoting complementarity. (B) ceb2 locus. (C and D) bxl1 and bxl2 loci. (E and F) agl1 and agl2 loci. RIP, right imperfect palindrome; PBS, potential binding sequence (60). Abbreviations and designations for panels B to F are the same as for panel A. For further explanations, see the text.


