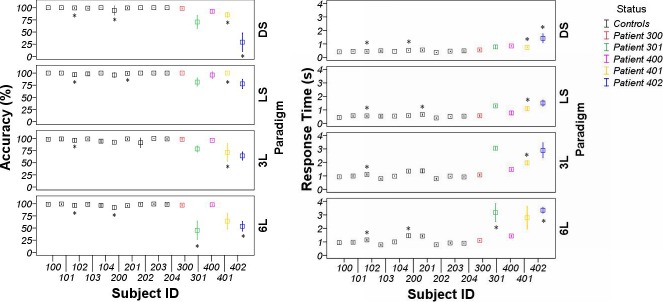
Figure 3. .
Error bar graph illustrating subjects' accuracy (left panels) and response time (right panels) during fMRI using the dot saccade (DS), letter saccade (LS), three-letter word recognition (3L), and six-letter word recognition (6L) paradigms. Error bar represents 1 SD of accuracy and response time across the 3 sessions. Each patient's data are represented by the same color used in Figure 2.

