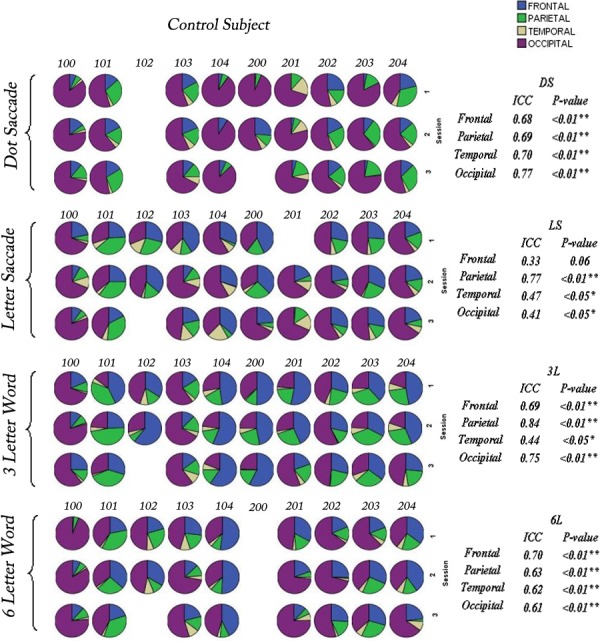
Figure 4. .

Pie charts for control subjects (100–204) illustrating the percentage activation across the 4 lobes of the cerebrum: frontal lobe = blue, parietal lobe = green, temporal lobe = yellow, and occipital lobe = magenta for all control subjects across 3 sessions for the 4 paradigms. Intraclass correlation has been applied to quantify the reproducibility of the activation patterns for each lobe across 3 sessions for the 4 paradigms. Intraclass correlation coefficients (ICCs) are presented on the right text panel. Significant correlations are indicated by asterisks (*P < 0.05; **P < 0.01). The missing pie charts indicate where data were not calculated due to excessive head movement. Overall, 16 of 150 (10.7%) acquisitions have been excluded from the control subject group.
