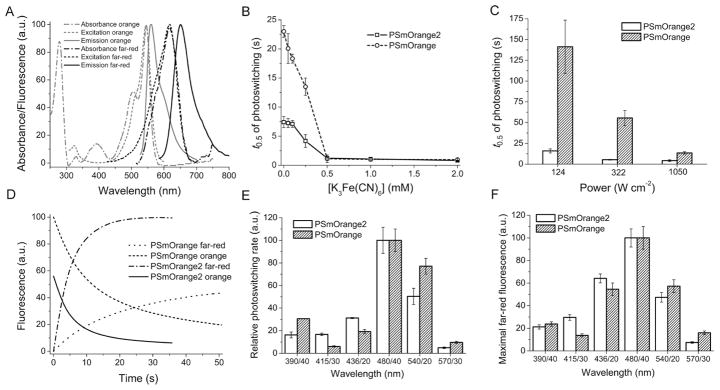
Figure 2.
Properties of the purified PSmOrange2 protein. (A) Absorbance, excitation and emission spectra of PSmOrange2 before and after photoswitching with 489 nm LED array. (B) Photoswitching half-times (t0.5) for PSmOrange2 and PSmOrange at indicated K3Fe(CN)6 concentrations and 1,050 mW cm−2 light power density. (C) Photoswitching half-times (t0.5) for PSmOrange2 and PSmOrange at indicated light power densities and 0.25 mM of K3Fe(CN)6. (D) Photoswitching kinetics for orange and far-red forms of PSmOrange and PSmOrange2. (E) Initial rates of photoswitching for PSmOrange and PSmOrange2 at indicated photoswitching wavelength bands normalized to 100% at 480/40 nm. (F) Maximal far-red fluorescence PSmOrange2 and PSmOrange achieved at indicated photoswitching wavelength bands normalized to 100% at 480/40 nm. In (B–D) the 480/40 nm wavelength band was used for photoswitching. In (D–F) the 0.25 mM of K3Fe(CN)6 and 1,050 mW cm−2 light power density were applied. The power densities were estimated at the sample. Error bars, SD.

