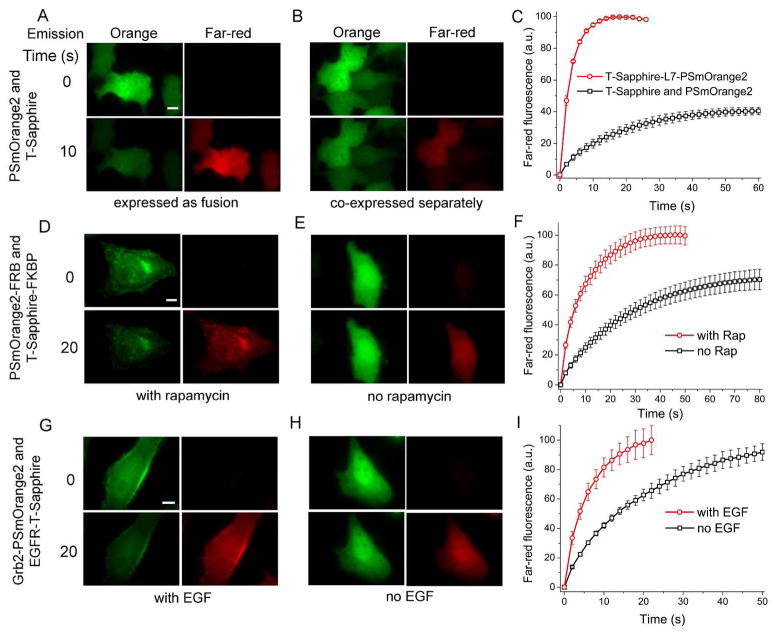
Figure 6.
FRET-facilitated photoswitching of PSmOrange2 in live HeLa cells. (A) Cytoplasmically expressed T-Sapphire and PSmOrange2 fusion construct and (B) co-expressed T-Sapphire and PSmOrange2 separately imaged in different fluorescence channels at indicated times during photoswitching. (C) Kinetics of far-red fluorescence intensities for cells in (A) and (B). Co-expressed membrane targeted T-Sapphire-FKBP and cytoplasmic PSmOrange2-FRB fusion proteins with (D) and without (E) supplemented 100 nM rapamycin imaged in different fluorescence channels at indicated times during photoswitching. (F) Kinetics of far-red fluorescence intensities for cells in (D) and (E). Co-expressed EGFR-T-Sapphire and Grb2-PSmOrange2 fusion proteins with (G) and without (H) supplemented 100 ng/ml EGF imaged in different fluorescence channels at indicated times during photoswitching. (I) Kinetics of far-red fluorescence intensities for cells in (G) and (H). The 415/30 nm wavelength band was used for photoswitching. Error bars, SD. Scale bars, 10 μm.

