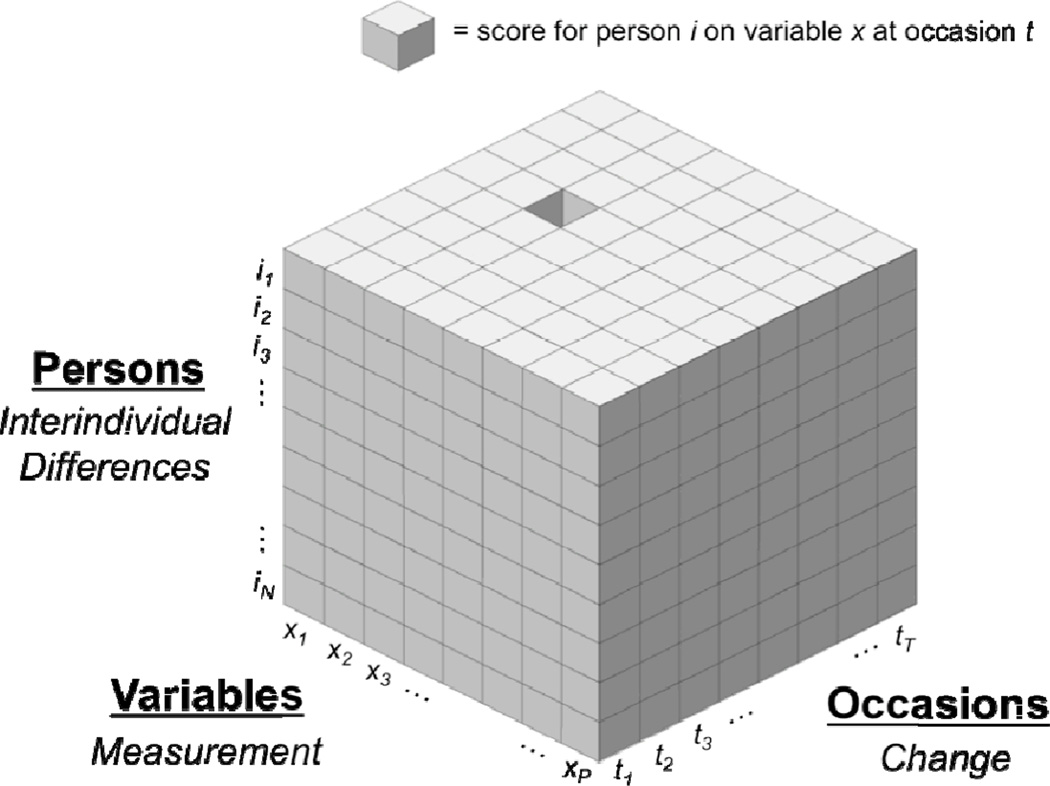
Figure 1.
Adaptation of Cattell’s (1952) three-dimensional data-box of persons × variables × occasions to represent multivariate longitudinal data. Each small cube represents the score for a single person on a particular variable obtained at a specific occasion. The person to whom the score/cube belongs is indexed by placement along the persons axis (i1, i2, …, iN), with all data associated with that person filling a distinct horizontal slice in the space. The variable to which a score pertains is indexed by a column along the variables axis (x1, x2, …, xP), and the time at which that observation was obtained is indexed along the occasions dimension (t1, t2, …, tT). The data-box is a useful heuristic for both assessing the conceptual assumptions and implications of a given research approach and selecting the appropriately aligned statistical models for measurement (variables dimension), change (occasions dimension), and interindividual differences (persons dimension).

